The Art of Data Visualization: Tips for Stunning Charts and Graphs
Data visualization is essential for presenting complex data in a way that is both engaging and easy to understand. To create stunning charts and graphs, it’s crucial to first identify your audience and their needs. Tailoring your visualizations to address these needs will enhance comprehension and retain interest. Utilize tools such as Tableau or Google Charts to craft interactive visualizations that invite exploration. Moreover, consider employing color theory effectively; use contrasting colors for differentiation and keep the color palette consistent throughout your visuals.
Another essential tip for creating impactful visualizations is to focus on simplicity and clarity. Avoid clutter by minimizing unnecessary elements and ensuring that your charts and graphs emphasize key insights. Use labels judiciously and consider incorporating Datawrapper for straightforward chart creation. When applicable, implement interactive elements such as tooltips to provide additional context without overwhelming the viewer. Remember, the goal of your visualization is to tell a story, so keep the narrative clear and concise, allowing your audience to grasp the main points quickly.
How to Choose the Right Visualization Style for Your Data
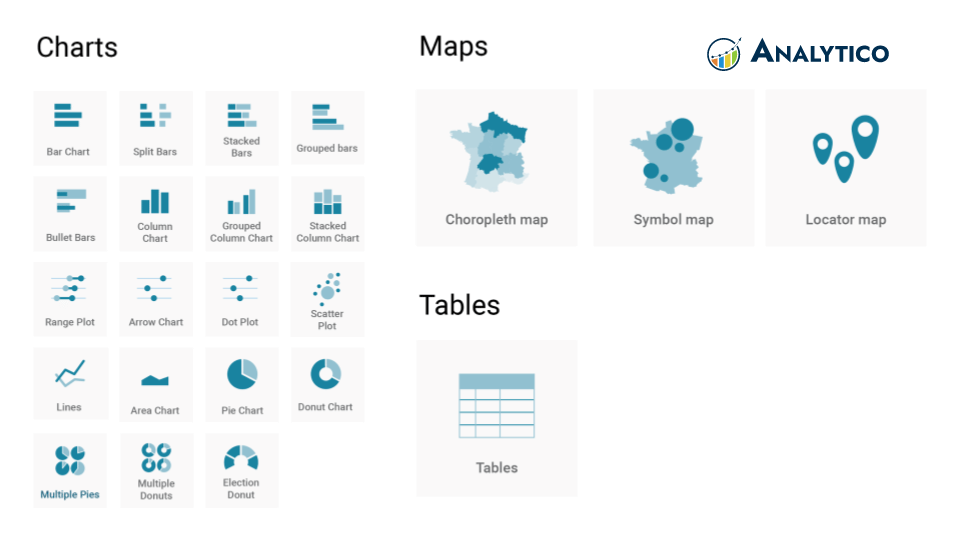
Choosing the right visualization style for your data is crucial to effectively communicate your insights. A strong first step is to identify the type of data you have and the story you wish to tell. For instance, if your goal is to show changes over time, a line graph or area chart may be the most suitable. Conversely, if you're comparing quantities across different categories, bar charts or column charts can be more effective. Always keep in mind the audience you are targeting; their familiarity with data visualizations can dictate the complexity of the style you choose. For further guidance on this process, you can check out resources such as Tableau’s best practices.
Once you have determined the appropriate format, consider the principles of design that can enhance understanding. Selecting the right color scheme, ensuring clear labeling, and maintaining simplicity are vital. Incorporating interactive elements can also engage your audience more deeply and allow them to explore the data in their own way. Moreover, utilizing tools like Microsoft Power BI or DigitalOcean’s overview of visualization tools can streamline the creation of your visualizations while providing various styles. To solidify your decision, gather feedback from peers to ensure that your chosen style resonates well with your intended message.
Data Storytelling: Transforming Numbers into Engaging Narratives
Data storytelling is a powerful technique that transforms raw data into engaging narratives, making complex information more accessible and relatable to a wider audience. By weaving data into a story, we can create an emotional connection that resonates with listeners, leading to better understanding and retention of information. This approach combines data visualization with compelling narratives, making the numbers speak for themselves while guiding the audience through the insights derived from them.
To effectively utilize data storytelling, it's essential to identify the key message you wish to convey and structure your narrative around it. Consider including different elements such as visual aids, trends, and interactive components to enhance the storytelling experience. Additionally, incorporating techniques like character development and conflict resolution within the data context can help make your message more compelling, keeping your audience engaged from start to finish.